Suite 02 · Production Performance
From last week’s numbers to right now.
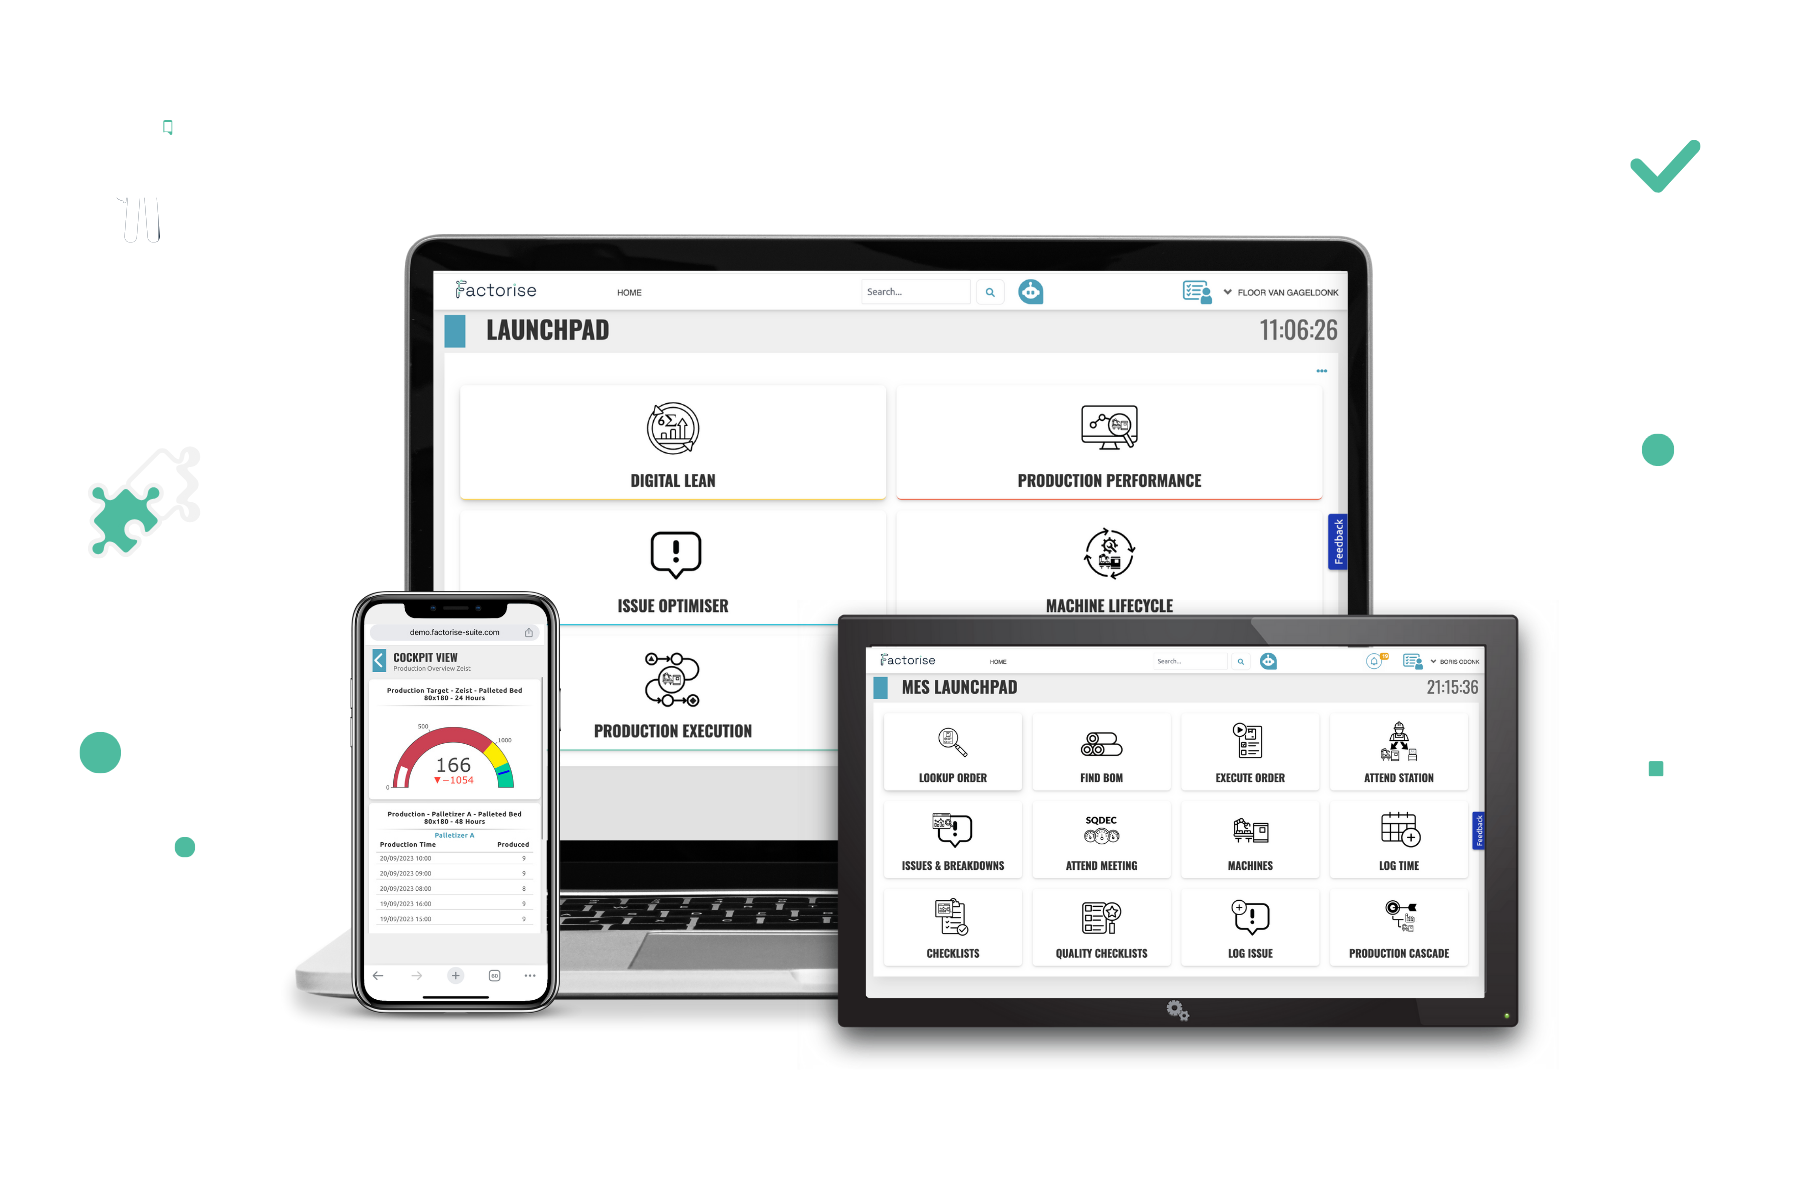
OEE arrives Monday morning, dashboards show the same numbers to everyone, and by the time you see a problem it’s already history. Factorise gives every role a live view — from operator to plant manager — with cascading dashboards, value stream insight and real-time KPIs.
Relevant for:
Production · Manufacturing Excellence · Management
8%
OEE improvement
Typical gain within 6–12 months of deploying real-time OEE visibility (industry benchmark)
30%
faster response to downtime.
Operations with live dashboards respond significantly faster than those using end-of-shift reporting.
20%
hidden capacity revealed
Most plants believe they run at 85–90% uptime. Once real-time monitoring goes live, the true number is 65–80% — that gap is recoverable capacity you didn’t know you had.
Pain points this suite solves
Sound familiar?
You have one OEE number for the whole plant — no visibility per line, per machine, or per shift until it’s too late to act.
Performance data cascades through three layers of management but never reaches the right person at the right moment.
Every role needs a different view, but configuring dashboards requires IT involvement and takes weeks.
All modules
6 modules.
One suite.
Andon Cockpit
What it does: A configurable live dashboard supporting multiple pages, custom KPI tiles, trend charts, and auto-refresh. Built differently per role or location.
Why it matters: Performance visibility that is actually relevant to the person looking at it. Generic dashboards that nobody reads are a common waste of investment.
Production Cascade
What it does: Visualises OEE, output, and downtime across all lines and shifts, cascading from machine to line to site.
Why it matters: A real picture of the production floor, live. Useful for anyone who has ever found out about a problem hours after it started.
Value Stream
What it does: A live Value Stream Map showing order flow across production stations, with running order, next order, and real-time throughput per station.
Why it matters: Makes flow problems visible. Bottlenecks and idle stations show up on screen instead of in a post-mortem conversation.
Schedule
What it does: Manages planned production loss and resource availability, integrated with the production schedule.
Why it matters: Planned stops and maintenance windows are factored in before they catch planning by surprise. Capacity decisions get more accurate.
Annotations
What it does: Lets operators and supervisors add context notes to performance metrics and trend charts.
Why it matters: The numbers tell you what happened. The annotations tell you why. Without a way to capture context it gets lost between shifts.
Provide Production Data
What it does: Manual data entry for production counts and events in areas without automated data collection.
Why it matters: Performance reporting stays complete even in parts of the operation that are not yet connected.
See it running in your environment
We’ll show you the Andon Cockpit and Production Cascade configured for your operation and your roles.